Table of Contents
Displaying an Average Temperature Forecast Chart
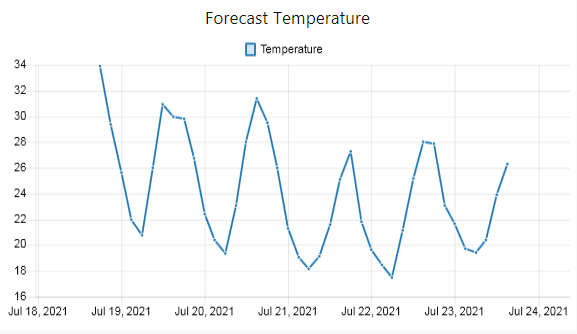
The free services provided by OpenWeatherMap can be used to plot a 5 day forecast (maximum available) of the temperature. The approach is to use the provided openweathermap Node-Red node that pulls data from OpenWeatherMap and then plot the output of the 5 day forecast. This is done by first splitting the output using the split node on the data.list parameter and then averaging the maximum and minimum temperature together to obtain a single datapoint. The result is then plotted on the chart provided by the Node Red dashboard as a line series where the time is given by the timestamp (converted to milliseconds) reported by OpenWeatherMap and the average temperature is plotted on the  axis. Unfortunately Node-Red does not have error bars nor trendlines such that the graph can only really display an evolution over 5 days.
Screenshots
Dashboard
Flow
Usage
Install the node-red-node-openweathermap module and then import the provided flow. The node-red-node-openweathermap node needs an API key to be generated which can be done by vising the OpenWeatherMap website.
Note that the API key will take about 10 minutes to start working such that the Node Red debug panel might display that an invalid API key has been provided till the API key is activated.
Requirements
npm install -g node-red-node-openweathermap
Flow
[{"id":"287b1f60.ea6f5","type":"tab","label":"Weather","disabled":false,"info":""},{"id":"e8a4da3.6ec6d28","type":"openweathermap","z":"287b1f60.ea6f5","name":"","wtype":"forecast","lon":"","lat":"","city":"","country":"","language":"en","x":350,"y":260,"wires":[["8483ed60.d97308"]]},{"id":"8483ed60.d97308","type":"change","z":"287b1f60.ea6f5","name":"","rules":[{"t":"set","p":"payload","pt":"msg","to":"data.list","tot":"msg"},{"t":"delete","p":"data","pt":"msg"}],"action":"","property":"","from":"","to":"","reg":false,"x":560,"y":260,"wires":[["8aafb7cf.172f68"]]},{"id":"6ab51b73.40df04","type":"ui_chart","z":"287b1f60.ea6f5","name":"","group":"f7af3caf.6618e","order":11,"width":0,"height":0,"label":"Forecast Temperature","chartType":"line","legend":"true","xformat":"auto","interpolate":"linear","nodata":"","dot":true,"ymin":"","ymax":"","removeOlder":"5","removeOlderPoints":"","removeOlderUnit":"86400","cutout":0,"useOneColor":false,"useUTC":false,"colors":["#1f77b4","#aec7e8","#ff7f0e","#2ca02c","#98df8a","#d62728","#ff9896","#9467bd","#c5b0d5"],"outputs":1,"useDifferentColor":false,"x":1420,"y":500,"wires":[[]]},{"id":"8aafb7cf.172f68","type":"split","z":"287b1f60.ea6f5","name":"","splt":"\\n","spltType":"str","arraySplt":1,"arraySpltType":"len","stream":false,"addname":"","x":730,"y":260,"wires":[["361c093f.4de5d6"]]},{"id":"361c093f.4de5d6","type":"change","z":"287b1f60.ea6f5","name":"","rules":[{"t":"set","p":"topic","pt":"msg","to":"Temperature","tot":"str"},{"t":"set","p":"timestamp","pt":"msg","to":"payload.dt","tot":"msg"},{"t":"set","p":"min","pt":"msg","to":"payload.main.temp_min","tot":"msg"},{"t":"set","p":"max","pt":"msg","to":"payload.main.temp_max","tot":"msg"}],"action":"","property":"","from":"","to":"","reg":false,"x":900,"y":260,"wires":[["17a3a835.cbb888"]]},{"id":"b443b22c.1b5348","type":"debug","z":"287b1f60.ea6f5","name":"","active":false,"tosidebar":true,"console":false,"tostatus":false,"complete":"true","targetType":"full","statusVal":"","statusType":"auto","x":1370,"y":140,"wires":[]},{"id":"6dab3bcc.83046c","type":"function","z":"287b1f60.ea6f5","name":"Timestamp to Milliseconds","func":"var time = parseInt(msg.timestamp) * 1000\nmsg.timestamp = time\n\nreturn msg;","outputs":1,"noerr":0,"initialize":"","finalize":"","libs":[],"x":1140,"y":200,"wires":[["b443b22c.1b5348","6ab51b73.40df04"]]},{"id":"17a3a835.cbb888","type":"function","z":"287b1f60.ea6f5","name":"Average Temperature","func":"var max = parseFloat(msg.max)\nvar min = parseFloat(msg.min)\n\nvar average = (max + min) / 2\n\nmsg.payload = average\n\nreturn msg;","outputs":1,"noerr":0,"initialize":"","finalize":"","libs":[],"x":1120,"y":320,"wires":[["6dab3bcc.83046c"]]},{"id":"f33677c9.239b78","type":"inject","z":"287b1f60.ea6f5","name":"Init","props":[{"p":"payload"},{"p":"topic","vt":"str"}],"repeat":"","crontab":"","once":true,"onceDelay":"1","topic":"","payload":"[]","payloadType":"json","x":130,"y":500,"wires":[["6ab51b73.40df04","6198455.fe731bc"]]},{"id":"2780e031.bfa968","type":"credentials","z":"287b1f60.ea6f5","name":"","props":[{"value":"location.city","type":"msg"},{"value":"location.country","type":"msg"},{"value":"apikey","type":"msg"}],"x":150,"y":260,"wires":[["e8a4da3.6ec6d28"]]},{"id":"6198455.fe731bc","type":"delay","z":"287b1f60.ea6f5","name":"","pauseType":"delay","timeout":"5","timeoutUnits":"seconds","rate":"1","nbRateUnits":"1","rateUnits":"second","randomFirst":"1","randomLast":"5","randomUnits":"seconds","drop":false,"x":140,"y":320,"wires":[["2780e031.bfa968"]]},{"id":"f7af3caf.6618e","type":"ui_group","name":"Office","tab":"565086d0.73918","order":1,"disp":true,"width":"12","collapse":false},{"id":"565086d0.73918","type":"ui_tab","name":"Ambiental","icon":"dashboard","disabled":false,"hidden":false}]
For the contact, copyright, license, warranty and privacy terms for the usage of this website please see the contact, license, privacy, copyright.


